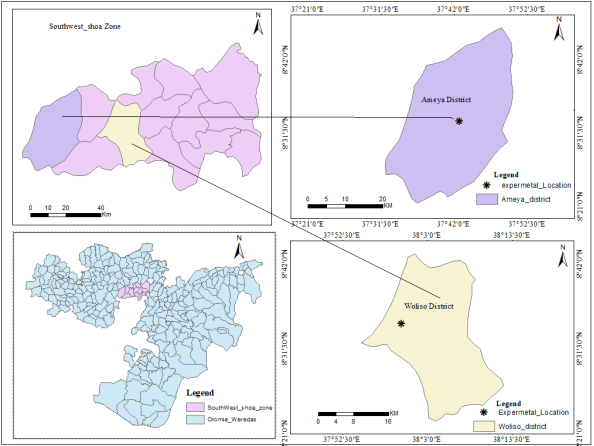
Inappropriate seed density and fertilizer management can lead to unstable crop yields. Excessive fertilizer application can potentially cause yield loss and nitrogen (N) leaching that leads to environmental pollution. The aim of this study was to explore the optimal N application rate and seed rate on bread wheat with different nitrogen responding under irrigation condition at two experimental sites in the South West Shewa, Ethiopia. A year field experiment was conducted to explore the effects of five N application rates (N0, N23, N46, N69, and N92) and three seed rates on bread wheat yield components like; - aboveground biomass, harvest index, number of tillers per plant, spike length, number of kernels per plant, grain yield and net return. The results showed that N application rate and seed rate were significantly interaction (P< 0.05) effect on aboveground biomass, harvest index, number of tillers per plant, spike length, number of kernels per plant and grain yield. Generally, spike length, number of tillers per plant and number of kernels per spike of wheat were increased with increased at some level in nitrogen fertilizer rate for the three seed rate at both locations. Highest number of kernels per spike (42.00, 44.00) and the highest mean above ground biomass yield (13.70 t ha-1, 7.5 t ha-1) were obtained for 150 kg ha -1 seed rate with 69 N kg ha-1 application at Ameya and Woliso sites respectively. The highest net benefit of 171531.88 EB ha-1 with marginal rate of return of 351.14% was obtained from 175 kg ha-1 seed rate with application of 69 kg N ha-1. Therefore, 175 kg ha-1 seed rate with application of 69 kg N ha-1 is economical feasible for bread wheat production at Ameya area and also the highest net benefit of 51675 EB ha-1 with marginal rate of return of 115.22% was obtained from 150 kg ha -1 seed rate with application of 69 kg N ha-1 at Woliso area.
| Published in | Journal of Plant Sciences (Volume 12, Issue 4) |
| DOI | 10.11648/j.jps.20241204.13 |
| Page(s) | 102-110 |
| Creative Commons |
This is an Open Access article, distributed under the terms of the Creative Commons Attribution 4.0 International License (http://creativecommons.org/licenses/by/4.0/), which permits unrestricted use, distribution and reproduction in any medium or format, provided the original work is properly cited. |
| Copyright |
Copyright © The Author(s), 2024. Published by Science Publishing Group |
Bread Wheat, Nitrogen Level, Seed Density, Productivity, Ameya, Woliso
Testing Location | PH-H₂O | Av p/ mg/kg soil | % O.C | % O.M | CEC Meq/100g soil | Texture (%) | |||
|---|---|---|---|---|---|---|---|---|---|
sand | clay | silt | Class | ||||||
Woliso (Obi kebele) | 6.5 | 8.12 | 2.07 | 3.57 | 21.83 | 31 | 40 | 29 | Clay |
Ameya (Marisekela kebele) | 6.4 | 5.58 | 1.77 | 3.05 | 21.3 | 45 | 20 | 35 | Loam |
Seed Rate (kg ha-1) | Nitrogen Level | PH (cm) | SL (cm) | NTPP | NKPP | ABM t ha-1 | HI (%) | GY (kg ha-1) |
|---|---|---|---|---|---|---|---|---|
125 | 0 | 75.1abcd | 6.7cd | 4b | 30d | 6.3h | 0.35d | 2834d |
23 | 78.8a | 6.8cd | 4b | 34cd | 10.0def | 0.37bc | 3760c | |
46 | 77.7ab | 7.2abcd | 5a | 35c | 11.1abcde | 0.40a | 4258bc | |
69 | 69.9bcd | 7.3abc | 5a | 40ab | 12.8abc | 0.43a | 4132bc | |
92 | 75.1abcd | 7.6ab | 5a | 40ab | 10.2def | 0.38ab | 2847d | |
150 | 0 | 77.5ab | 6.7cd | 3c | 35c | 7.1gh | 0.37bc | 2705d |
23 | 78.7a | 6.8bcd | 4b | 35c | 10.7cdef | 0.36cd | 4045bc | |
46 | 79.1a | 7.2abc | 5a | 40ab | 12.1abcd | 0.38ab | 4663ab | |
69 | 68.3cd | 7.4abc | 4b | 42a | 13.7a | 0.38ab | 5034a | |
92 | 74.0abcd | 7.6a | 5a | 43a | 13.5a | 0.38ab | 4942ab | |
175 | 0 | 76.2abc | 6.4d | 3c | 35c | 8.4fgh | 0.31de | 2914d |
23 | 78.7a | 6.8cd | 4b | 35cd | 11.0abcde | 0.34d | 4083bc | |
46 | 67.1d | 7.1abcd | 5a | 36bc | 13.4ab | 0.38ab | 4155bc | |
69 | 67.3d | 6.9abcd | 5a | 37bc | 13.1abc | 0.38ab | 5037a | |
92 | 73.3abcd | 7.2abc | 5a | 40ab | 9.4efg | 0.38ab | 3897c | |
CV (%) | 7.21 | 5.10 | 10.86 | 6.36 | 12.17 | 6.02 | 8.2 | |
LSD (5%) | 8.72 | 0.78 | 0.87 | 4 | 2.46 | 0.04 | 634 |
Seed Rate (kg ha-1) | Nitrogen Level | PH (cm) | SL (cm) | NTPP | NKPP | ABM t ha-1 | HI (%) | GY (kg ha-1) |
|---|---|---|---|---|---|---|---|---|
125 | 0 | 66.5bcd | 7.73bcd | 5de | 33c | 4.4bcd | 0.33b | 1704efg |
23 | 66.9bcd | 8.07abc | 5cd | 40b | 5.5abcd | 0.32b | 1739efg | |
46 | 72.5ab | 7.87abcd | 6a | 39b | 7.0ab | 0.36ab | 2492ab | |
69 | 68.3abcd | 8.53ab | 5cd | 41b | 6.4abc | 0.37a | 2431ab | |
92 | 70.5abc | 8.53ab | 5cd | 42ab | 5.5abcd | 0.34ab | 1893cdef | |
150 | 0 | 63.3d | 7.73bcd | 4f | 40b | 5.2bcd | 0.30cd | 1563fg |
23 | 67.5bcd | 7.53cd | 4ef | 39b | 5.5abcd | 0.35bc | 1949cde | |
46 | 69.3abcd | 7.83bcd | 6a | 41ab | 6.8ab | 0.32bc | 2210bc | |
69 | 74.2a | 8.73a | 6a | 44a | 7.5a | 0.38a | 2574a | |
92 | 69.3abcd | 8.33abc | 5de | 41b | 6.7ab | 0.32b | 2155bc | |
175 | 0 | 53.0e | 7.10d | 4ef | 32c | 4.0d | 0.26cd | 1398g |
23 | 66.1bcd | 7.10d | 5cd | 32c | 5.1bcd | 0.35ab | 1799def | |
46 | 64.4bcd | 8.03abc | 5cd | 42ab | 7.5a | 0.35ab | 1970cde | |
69 | 69.5abcd | 7.93abcd | 5cd | 35c | 7.6a | 0.29bc | 2183bc | |
92 | 69.5abcd | 7.93abcd | 6a | 41b | 6.5abc | 0.33ab | 2150bcd | |
CV (%) | 4.4 | 5.10 | 6.03 | 4.87 | 17.60 | 8.78 | 10.12 | |
LSD (5%) | 6.49 | 0.89 | 0.72 | 3.00 | 0.05 | 355 | 2.20 |
Seed Rate (kgha-1) | Nitrogen Level | Grain Yield (Kg ha-1) | Gross Benefit (birr) | Cost of Urea (ETB ha-1 | Labor cost | TVC | Net Benefit (ETB ha-1) | MRR (%) |
|---|---|---|---|---|---|---|---|---|
125 | 0 | 2834.00 | 88562.50 | 0.00 | 42000.00 | 45125.00 | 43437.50 | 0 |
23 | 3759.70 | 117490.63 | 825.00 | 42000.00 | 45950.00 | 71540.63 | 155.69 | |
46 | 4257.70 | 133053.13 | 1650.00 | 42000.00 | 46775.00 | 86278.13 | 184.45 | |
69 | 5132.00 | 160375.00 | 2475.00 | 42000.00 | 47600.00 | 112775.00 | 236.92 | |
92 | 2846.70 | 88959.38 | 3300.00 | 42000.00 | 48425.00 | 40534.38 | 83.71 | |
150 | 0 | 2704.70 | 101426.25 | 0.00 | 42000.00 | 45750.00 | 55676.25 | 121.70 |
23 | 4045.30 | 151698.75 | 825.00 | 42000.00 | 46575.00 | 105123.75 | 225.71 | |
46 | 4663.30 | 174873.75 | 1650.00 | 42000.00 | 47400.00 | 127473.75 | 268.93 | |
69 | 4941.70 | 185313.75 | 2475.00 | 42000.00 | 48225.00 | 137088.75 | 284.27 | |
92 | 5034.00 | 188775.00 | 3300.00 | 42000.00 | 49050.00 | 139725.00 | 284.86 | |
175 | 0 | 2914.00 | 127487.50 | 0.00 | 42000.00 | 46375.00 | 81112.50 | 174.91 |
23 | 4082.70 | 178618.13 | 825.00 | 42000.00 | 47200.00 | 131418.13 | 278.43 | |
46 | 4155.00 | 181781.25 | 1650.00 | 42000.00 | 48025.00 | 133756.25 | 278.51 | |
69 | 5037.30 | 220381.88 | 2475.00 | 42000.00 | 48850.00 | 171531.88 | 351.14 | |
92 | 3897.00 | 170493.75 | 3300.00 | 42000.00 | 49675.00 | 120818.75 | 243.22 |
Seed Rate (kgha-1) | Nitrogen Level | Grain Yield (Kg ha-1) | Gross Benefit (birr) | Cost of Urea (ETB ha-1 | Labor cost | TVC | Net Benefit (ETB ha-1) | MRR (%) |
|---|---|---|---|---|---|---|---|---|
125 | 0 | 1704.00 | 53250.00 | 0.00 | 42000.00 | 45125.00 | 8125.00 | 0 |
23 | 1739.00 | 54343.75 | 825.00 | 42000.00 | 45950.00 | 8393.75 | 18.27 | |
46 | 2492.00 | 77875.00 | 1650.00 | 42000.00 | 46775.00 | 31100.00 | 66.49 | |
69 | 2431.00 | 75968.75 | 2475.00 | 42000.00 | 47600.00 | 28368.75 | 59.60 | |
92 | 1893.00 | 59156.25 | 3300.00 | 42000.00 | 48425.00 | 10731.25 | 22.16 | |
150 | 0 | 1563.00 | 58612.50 | 0.00 | 42000.00 | 42375.00 | 16237.50 | 38.32 |
23 | 1949.00 | 73087.50 | 825.00 | 42000.00 | 43200.00 | 29887.50 | 69.18 | |
46 | 2210.00 | 82875.00 | 1650.00 | 42000.00 | 44025.00 | 38850.00 | 88.25 | |
69 | 2574.00 | 96525.00 | 2475.00 | 42000.00 | 44850.00 | 51675.00 | 115.22 | |
92 | 2155.00 | 80812.50 | 3300.00 | 42000.00 | 45675.00 | 35137.50 | 76.93 | |
175 | 0 | 1398.00 | 61162.50 | 0.00 | 42000.00 | 46375.00 | 14787.50 | 31.89 |
23 | 1799.00 | 78706.25 | 825.00 | 42000.00 | 47200.00 | 31506.25 | 66.75 | |
46 | 1970.00 | 86187.50 | 1650.00 | 42000.00 | 48025.00 | 38162.50 | 79.46 | |
69 | 2183.00 | 95506.25 | 2475.00 | 42000.00 | 48850.00 | 46656.25 | 95.51 | |
92 | 2150.00 | 94062.50 | 3300.00 | 42000.00 | 49675.00 | 44387.50 | 89.36 |
EB | Ethiopian Birr |
TVC | Total Value Cost |
MRR | Marginal Rate of Return |
| [1] | CIMMYT, 1988. From Agronomic Data to Farmer Recommendations : An Economics Training Manual. Completely. Mexico. |
| [2] | CSA, 2021. The Federal Democratic Republic Of Ethiopia Central Statistical Agency Volume Vii Report On (Private Peasant Holdings, Meher Season) Cereals utilization ( in percent ). Addis Ababa. |
| [3] |
FAO (2017), “FAOSTAT”, FAO, Rome, available at:
http://faostat.fao.org (accessed September 2017) |
| [4] | Haileselassie, B., Habte, D., Haileselassie, M., Gebremeskel, G., 2014. Effects of mineral nitrogen and phosphorus fertilizers on yield and nutrient utilization of bread wheat (Tritcum aestivum) on the sandy soils of Hawzen District, Northern Ethiopia. |
| [5] | Iqbal, J., Hayat, K., Hussain, S., Ali, A., Bakhsh, M. A. A. H. A., 2012. Effect of seeding rates and nitrogen levels on yield and yield components of wheat (Triticum aestivum L.). Pakistan J. Nutr. 11, 531–536. |
| [6] | Mandic, V., Krnjaja, V., Tomic, Z., Bijelic, Z., Simic, A., Muslic, D.R., Gogic, M., 2015. Nitrogen fertilizer influence on wheat yield and use efficiency under different environmental conditions. Chil. J. Agric. Res. 75, 92–97. |
| [7] | Majeed, M.A., Ahmad, R., Tahir, M., Tanveer, A., Ahmad, M., 2014. Effect of phosphorus fertilizer sources and rates on growth and yield of wheat (triticum aestivum L.). Asian J. Agric. Biol. 2, 14–19. |
| [8] | Noureldin, N.A., H.S. Saudy, F. Ashmawy, and H.M. Saed. 2013. Grain yield response index of bread wheat cultivars as influenced by nitrogen levels. Annals of Agricultural Science 58:147-152. |
| [9] | Olsen, S. R., Cole, C. V., Watanabe, F. S. & Dean. L. A. (1954). Estimation of available phosphorus in soils by extraction with NaHCO3, USDA Cir.939. U. S. Washington. |
| [10] | Prout, J. M., Shepherd, K., McGrath, S., Kirk, G., & Haefele, S. (2020). What is a good level of soil organic matter? An index based on organic carbon to clay ratio. European Journal of Soil Science, 72, 2493-2503. |
| [11] | Rahi, A. H. E., Mihbis, A. T. F., 2021. Effect of Nitrogen Fertilizer and Rate of Seeds on Some Growth Criteria and Dry Matter Production of Barley (Hordeum Vulgare L.). IOP Conf. Ser. Earth Environ. Sci. 923. |
| [12] | Rhoades, J. D. (1996). Salinity: Electrical conductivity and total dissolved solids. Methods of Soil Analysis Part 3—Chemical Methods, (methodsofsoilan3). pp. 417-435. |
| [13] | Wakley and Black, 1934. Standard operating procedure for soil organic carbon Walkley-Black. |
| [14] |
Yesuf NS, Getahun S, Hassen S, Alemayehu Y, Danu KG, Alemu Z, Tesfaye T, Hei NB, Blasch G. Distribution, dynamics, and physiological races of wheat stem rust (Puccinia graminis f.sp. tritici) on irrigated wheat in the Awash River Basin of Ethiopia. PLoS One. 2021 Sep 23; 16(9): e0249507.
https://doi.org/10.1371/journal.pone.0249507 PMID: 34555040; PMCID: PMC8459957. |
| [15] | Zewdie, T., Hunegnaw, A., 2021. TZ and AH wheat seed rate 2020 Review on the effects of seed rates on growth, yield components and yield of bread wheat (Triticum aestivum L.) 1, 47–52. |
| [16] | Zhang, P., Qi, Y. K., Wang, H. G., He, J. N., Li, R. Q., Liang, W. L., 2021. Optimizing nitrogen fertilizer amount for best performance and highest economic return of winter wheat under limited irrigation conditions. PLoS One 16, 1–17. |
APA Style
Zike, T., Nekir, B., Bekele, T., Hassan, M., Fekre, T., et al. (2024). Effect of Nitrogen Fertilizer and Seed rates on Yield and Yield Components of Bread Wheat in the Irrigated Condition of South West Shewa, Central Highland of Ethiopia. Journal of Plant Sciences, 12(4), 102-110. https://doi.org/10.11648/j.jps.20241204.13
ACS Style
Zike, T.; Nekir, B.; Bekele, T.; Hassan, M.; Fekre, T., et al. Effect of Nitrogen Fertilizer and Seed rates on Yield and Yield Components of Bread Wheat in the Irrigated Condition of South West Shewa, Central Highland of Ethiopia. J. Plant Sci. 2024, 12(4), 102-110. doi: 10.11648/j.jps.20241204.13
AMA Style
Zike T, Nekir B, Bekele T, Hassan M, Fekre T, et al. Effect of Nitrogen Fertilizer and Seed rates on Yield and Yield Components of Bread Wheat in the Irrigated Condition of South West Shewa, Central Highland of Ethiopia. J Plant Sci. 2024;12(4):102-110. doi: 10.11648/j.jps.20241204.13
@article{10.11648/j.jps.20241204.13,
  author = {Takele Zike and Bethel Nekir and Teshome Bekele and Mohammed Hassan and Tesfahun Fekre and Fetta Negash and Tesfaye Yakob},
  title = {Effect of Nitrogen Fertilizer and Seed rates on Yield and Yield Components of Bread Wheat in the Irrigated Condition of South West Shewa, Central Highland of Ethiopia
},
  journal = {Journal of Plant Sciences},
  volume = {12},
  number = {4},
  pages = {102-110},
  doi = {10.11648/j.jps.20241204.13},
  url = {https://doi.org/10.11648/j.jps.20241204.13},
  eprint = {https://article.sciencepublishinggroup.com/pdf/10.11648.j.jps.20241204.13},
  abstract = {Inappropriate seed density and fertilizer management can lead to unstable crop yields. Excessive fertilizer application can potentially cause yield loss and nitrogen (N) leaching that leads to environmental pollution. The aim of this study was to explore the optimal N application rate and seed rate on bread wheat with different nitrogen responding under irrigation condition at two experimental sites in the South West Shewa, Ethiopia. A year field experiment was conducted to explore the effects of five N application rates (N0, N23, N46, N69, and N92) and three seed rates on bread wheat yield components like; - aboveground biomass, harvest index, number of tillers per plant, spike length, number of kernels per plant, grain yield and net return. The results showed that N application rate and seed rate were significantly interaction (P-1, 7.5 t ha-1) were obtained for 150 kg ha -1 seed rate with 69 N kg ha-1 application at Ameya and Woliso sites respectively. The highest net benefit of 171531.88 EB ha-1 with marginal rate of return of 351.14% was obtained from 175 kg ha-1 seed rate with application of 69 kg N ha-1. Therefore, 175 kg ha-1 seed rate with application of 69 kg N ha-1 is economical feasible for bread wheat production at Ameya area and also the highest net benefit of 51675 EB ha-1 with marginal rate of return of 115.22% was obtained from 150 kg ha -1 seed rate with application of 69 kg N ha-1 at Woliso area.
},
 year = {2024}
}
TY  - JOUR
T1  - Effect of Nitrogen Fertilizer and Seed rates on Yield and Yield Components of Bread Wheat in the Irrigated Condition of South West Shewa, Central Highland of Ethiopia

AU  - Takele Zike
AU  - Bethel Nekir
AU  - Teshome Bekele
AU  - Mohammed Hassan
AU  - Tesfahun Fekre
AU  - Fetta Negash
AU  - Tesfaye Yakob
Y1  - 2024/08/27
PY  - 2024
N1  - https://doi.org/10.11648/j.jps.20241204.13
DO  - 10.11648/j.jps.20241204.13
T2  - Journal of Plant Sciences
JF  - Journal of Plant Sciences
JO  - Journal of Plant Sciences
SP  - 102
EP  - 110
PB  - Science Publishing Group
SN  - 2331-0731
UR  - https://doi.org/10.11648/j.jps.20241204.13
AB  - Inappropriate seed density and fertilizer management can lead to unstable crop yields. Excessive fertilizer application can potentially cause yield loss and nitrogen (N) leaching that leads to environmental pollution. The aim of this study was to explore the optimal N application rate and seed rate on bread wheat with different nitrogen responding under irrigation condition at two experimental sites in the South West Shewa, Ethiopia. A year field experiment was conducted to explore the effects of five N application rates (N0, N23, N46, N69, and N92) and three seed rates on bread wheat yield components like; - aboveground biomass, harvest index, number of tillers per plant, spike length, number of kernels per plant, grain yield and net return. The results showed that N application rate and seed rate were significantly interaction (P-1, 7.5 t ha-1) were obtained for 150 kg ha -1 seed rate with 69 N kg ha-1 application at Ameya and Woliso sites respectively. The highest net benefit of 171531.88 EB ha-1 with marginal rate of return of 351.14% was obtained from 175 kg ha-1 seed rate with application of 69 kg N ha-1. Therefore, 175 kg ha-1 seed rate with application of 69 kg N ha-1 is economical feasible for bread wheat production at Ameya area and also the highest net benefit of 51675 EB ha-1 with marginal rate of return of 115.22% was obtained from 150 kg ha -1 seed rate with application of 69 kg N ha-1 at Woliso area.

VL  - 12
IS  - 4
ER  -
Ethiopian Institute of Agricultural Research, Wolkite Agricultural Research Centre, Addis Ababa, Ethiopia
Ethiopian Institute of Agricultural Research, Wolkite Agricultural Research Centre, Addis Ababa, Ethiopia
Ethiopian Institute of Agricultural Research, Wolkite Agricultural Research Centre, Addis Ababa, Ethiopia
Ethiopian Institute of Agricultural Research, Wolkite Agricultural Research Centre, Addis Ababa, Ethiopia
Ethiopian Institute of Agricultural Research, Wolkite Agricultural Research Centre, Addis Ababa, Ethiopia
Ethiopian Institute of Agricultural Research, Wolkite Agricultural Research Centre, Addis Ababa, Ethiopia
Ethiopian Institute of Agricultural Research, Wolkite Agricultural Research Centre, Addis Ababa, Ethiopia